
1 Introduction
White LED (WLED) is a new generation of solid-state green light source with many advantages such as energy saving, environmental protection, small size, high luminous efficiency, and stable performance.
At present WLED uses PC/MC to realize the white light path: 1) blue LED chip + yellow phosphor; 2) violet LED chip + red + green + blue trichromatic phosphor; 3) blue LED chip + green LED chip + Red LED chip. Among the three ways to achieve white light, the most economical and practical way to realize industrialization is to use blue LED chips coated with yellow phosphors. The WLED's luminous efficacy using this approach is as high as 250lm/W. With the increasingly fierce market competition of lighting terminal products and the increasingly poor heat dissipation environment of lighting fixtures, LED light sources must have better thermal characteristics to meet market demands. The thermal characteristics of LED light sources are usually characterized using light output heat-to-heat ratios. WLED's light output heat-to-heat ratio is the ratio of photoelectric parameters (light flux) of LED light source at high temperature and photoelectric parameters (light flux) at normal temperature. This indicator can be used to verify the pros and cons of LED light source thermal stability.
In WLED light sources, phosphors play a crucial role in the realization of white light. Phosphors are generally inorganic phosphors and have an ordered crystal structure. The stability of their physicochemical properties is related to the following factors: material system, dispersion coefficient, compatibility of powder adhesive, and powder morphology. The influence of the WLED light output heat-to-heat ratio is related to the WLED device material, which is a key material in the aforementioned devices. Phosphor physical properties (material system, dispersion coefficient, powder adhesive compatibility, powder morphology) have not been reported in the study of WLED light output heat-to-heat ratio, and at the same time, the problem of solving the thermal characteristics of LED light sources appears to be Importantly, it is of practical significance to explore the relationship between the physical properties of the phosphor and the cold-to-heat ratio of the WLED light output. At the same time, it has a certain guiding role in the follow-up product design.
2. Experimental section
This article uses SMD 2835 package form, blue chip, emission band in the 450-455nm, each LED light source has 3 series of LED chips, phosphor scheme from YAG yellow fluorescent material, nitride red fluorescent material and Ga-YAG/LuAG Yellow green fluorescent material composition. Each set of experiments only changed the type of yellow-green powder while fixing the amount of glue and the other two phosphor contents, and each LED light source had the same amount of glue dispensed. The ratios of yellow, red and yellow-green phosphors and glues are yellow: red: yellow-green: glue = 0.50: 0.15: 1.5:1. Five samples with the same phosphor ratio are selected for testing. The test conditions are pulses. Current 100 mA, test temperature points 25 °C, 50 °C, 75 °C, 85 °C, 95 °C, 105 °C, taking the average luminous flux. Powder parameter testing equipment: The particle size is measured with a laser particle size analyzer, and the thermal quenching performance and excitation emission spectrum are tested with Fluoromax-4; the particle SEM morphology is measured with a scanning electron microscope; the encapsulation equipment: ASM solid crystal machine, ASM wire Machine, vacuum deaeration machine, Musashi dispensing machine. Package finished optical parameters test equipment: remote integration ball tester.
3. Results and discussion
Phosphors are generally inorganic materials. According to their matrix classification, commonly used systems include aluminate, nitride/oxynitride, silicate, and fluoride. Figure 1.1 shows the thermal quenching performance of phosphors in different systems. It can be seen that the thermal stability of aluminates in the powders of several systems is the best, the thermal stability of fluorides and silicates is poor, and the heat of nitrides is The stability is worse than aluminate but superior to fluorides and silicates.
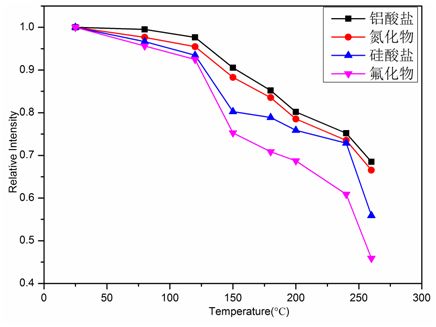
Figure 1.1 Thermal quenching performance of different phosphors
Fig.1.1 The heat quenching properties of different system fluorescent powder
Therefore, this study uses aluminate system as the research object. The representative aluminate system is YAG, its chemical formula is Y3Al5O12:Ce, its crystal structure belongs to cubic system, its lattice constant is 1.2002nm, and its crystal structure is shown in Figure 1.2. As can be seen from the crystal structure, there are three polyhedrons in the space composed of Y, Al, and O, namely: dodecahedron (Fig. 1.2a), octahedron (Fig. 1.2b), tetrahedron (Fig. 1.2c), Among them, the coordination number of oxygen atoms is (Y33+) eight-coordinate, (Al23+) six-coordinate, and (Al33+) four-coordinate.
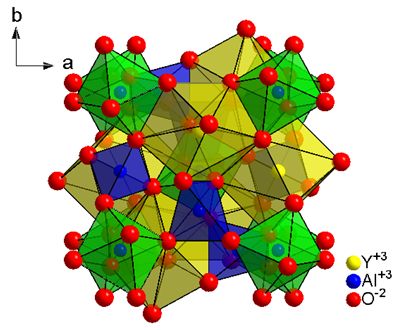
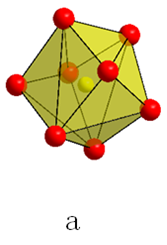
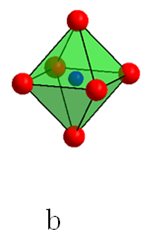
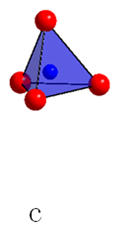
Figure 1.2 Crystal structure of YAG
Fig.1.2 The schematic of YAG crystal structure
3.1 Effect of Phosphor Material on WLED Light Output Cooling-heat Ratio
This experiment uses Ga-YAG and LuAG yellow-green powder as the research object. The crystal structure of Ga-YAG and LuAG in the same yttrium aluminum garnet is shown in Figure 1.1. The chemical formula of yttrium aluminum garnet is:
(RE1-rSmr)3(Al1-sGas)O12:Ce(1)
In formula (1), RE = La, Lu, Y, Gd, Sc, 0 ≤ r < 1, 0 ≤ s ≤ 1. In general, Ga-YAG and LuAG belong to a cubic system, but their cell parameters are different. Ga-YAG is a partial substitution of Ga3+ to Al3+, while LuAG is a complete replacement of Lu3+ to Y3+, and its ion radius is: rGa3+ (8-coordinates) = 0.69 ?, rY3 + (octacoordinate) = 1.04 ?, rAl3 + (hexacoordinate) = 0.62 ?, rLu3 + (hexacoordinate) = 1.001 ? [4]. Combined with the matching degree of the ionic radius, theoretically the complete substitution will be better than the thermal stability of the crystal structure formed by the partial substitution. From the material point of view, the thermal stability of the material itself can be characterized by thermal quenching properties.
Figure 1.3 shows the relationship between the thermal quenching performance of GRF-G and GRF-L. It can be seen that as the temperature rises, the brightness decay of the powder shows a downward trend, in which the heat of GRF-L The quenching performance is better than that of GRF-G.
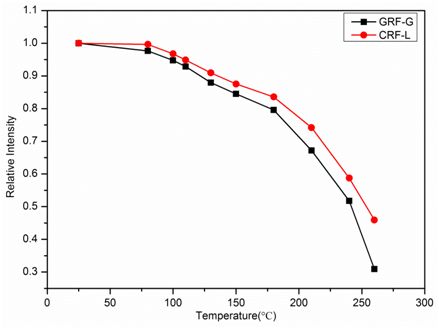
Figure 1.3 Thermal quenching performance of GRF-G and GRF-L
Fig.1.3 The heat quenching properties of GRF-G and GRF-L
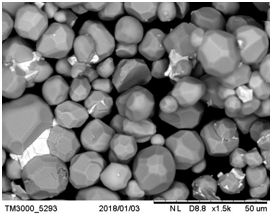
Ga-YAG and LuAG were GRF-G and GRF-L, respectively. The electron microscopy morphology was as shown in Fig. 1.4. It can be concluded that the GRF-G and GRF-L particles are approximately spherical in shape, with a smooth surface.
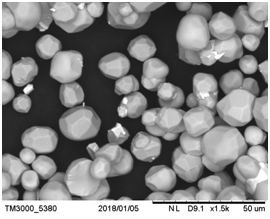
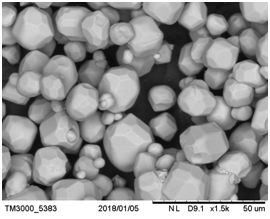
The SEM images of GRF-G and GRF-L in the left and right panels of Figure 1.4, respectively
Fig.1.4 The SEM morphology of GRF-G (left) and GRF-L (right)
Using GRF-G and GRF-L as the yellow green powder packaged into 2835 finished lamp beads, the change between the luminous flux of the finished lamp beads and the test temperature is shown in Fig. 1.5. It can be seen that the ratio of the heat flux to the cold-heat ratio gradually increases with temperature. Falling, the WLED light output at 85°C is better than GRF-G over GRF-G.
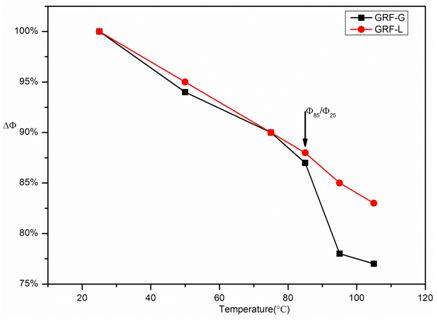
Figure 1.5 WLED light output thermal ratio of GRF-G and GRF-L
Fig.1.5 specific value of the effects of ordinary parameters on ordinary and high temperature of light output with WLED of GRF-G and GRF-L
GRF-G and GRF-L WLED light output heat and cold ratio, GRF-L is better than GRF-G, which is related to the thermal quenching properties of fluorescent materials and the structure of the powder itself, so different materials of light conversion material (part Substitutions and complete substitutions have an effect on the cold-to-heat ratio of the WLED light output.
3.2 Effect of the dispersion coefficient of phosphor on the cold-heat ratio of WLED light output
The dispersion coefficient refers to a measure of the relative width or non-uniformity of the particle size distribution of a phosphor sample. It is defined as the ratio of the distribution width to the center particle size, where the distribution width is the difference of a set of characteristic particle sizes of the boundary particle size, and the dispersion coefficient generally adopts the following expression:
S=(d90-d10)/d50 (2)[5]
In formula (2), S denotes the dispersion coefficient, and d10, d50, and d90 are the particle sizes corresponding to 10%, 50%, and 90% of the powder in the volume cumulative distribution of the powder respectively. The unit is um, where d50 denotes the powder particles. The median particle size. In general, the smaller the S value is, the more concentrated the powder particle size distribution is, and the number of defects on the particle surface per unit volume is generally the same, and the thermal performance is not differentiated, and the thermal stability is better. In this experiment, GRF-S, GRF-M, and GRF-B were used as the yellow-green powders. They were packaged with the same yellow powder and red powder, and the dispersion coefficients of GRF-S, GRF-M, and GRF-B were respectively This is: 0.925, 1.125, 1.325. Figure 1.6 shows the thermal quenching performance of GRF-S, GRF-M, and GRF-B with different dispersion coefficients. It can be seen that the brightness of the fluorescent material is continuously attenuated with increasing temperature, with GRF-B having the largest attenuation The second is GRF-M, and the lowest is GRF-S. The best heat-quenching performance of GRF-S is among them. Therefore, from the powder point of view, the thermal quenching performance of the small dispersion coefficient is better, which is consistent with the foregoing analysis conclusions.
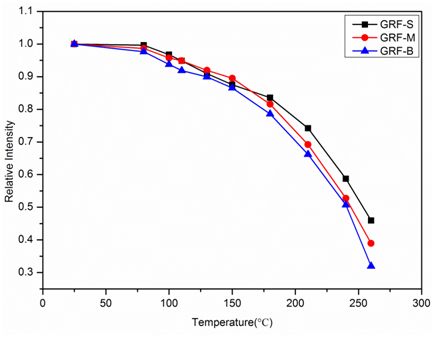
Figure 1.6 Thermal quenching performance of GRF-S, GRF-M and GRF-B
Fig.1.6 The heat quenching properties of GRF-S, GRF-M and GRF-B
In this paper, the influence of dispersion coefficient on the cold-to-heat ratio of WLED light output is studied. The package format of 2835 is used. The target parameters are Ra=80-82 and CCT=3000K. The same packaging scheme is used to verify that the different dispersion coefficients cool the WLED light output. The relationship between thermal ratios, Figure 1.7 shows the relationship between the thermal output ratio and WLED light output of GRF-S, GRF-M, and GRF-B with different dispersion coefficients. As the temperature rises, the ratio of the cold and hot states of the pearl light flux of the finished lamp is constantly increasing. Small, GRF-S, GRF-M, GRF-B in the finished product attenuation amplitude GRF-B largest, GRF-M second, GRF-S minimum, indicating that GRF-S WLED light output heat and cold ratio is the best, GRF The WLED light output of -B has the worst cold-to-heat ratio, so different dispersion coefficients affect the cold-to-heat ratio of the WLED light output. The smaller the dispersion coefficient, the better the cold-heat ratio of the WLED light output.
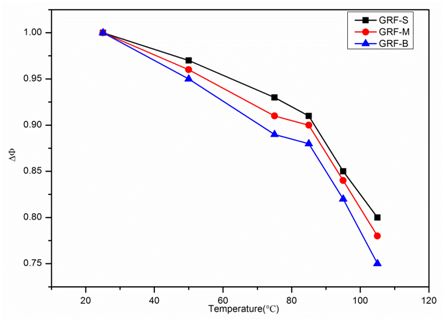
Figure 1.7 WLED light output heat-to-heat ratio relationship for GRF-S, GRF-M, and GRF-B
Fig.1.7 specific value of availably values ​​of ordinary and high temperature of light output with WLED of GRF-S,GRF-M and GRF-B
3.3 The influence of the compatibility of powder glue on the heat output ratio of WLED
After the phosphor is synthesized, in order to improve the stability of the product, a certain post-treatment process is usually used, such as secondary quenching, cladding, etc., and the cladding process is more commonly used. The packaging material used is SiO2, but Even with such a process, the thermal stability of the device may be poorly reflected in the WLED light output heat-to-heat ratio. Generally, when the phosphor is mixed with the encapsulant in the packaging process, there may be a certain gap between the surface of the particle and the colloidal surface. The inside may contain undischarged air, which may affect the thermal stability of the finished product when it is heated. In order to solve this problem. Some related manufacturers have proposed a brand-new post-treatment process, which includes a special material on the surface of the phosphor particles through a certain coating method. After a special treatment, the phosphors will rapidly condense into a large particle. In order to prevent moisture from entering, the particles processed by this process, when combined with the encapsulant, will enclose the encapsulant tightly on the surface of the particles, there is no problem of voids, and the compatibility of the powder is increased. Theoretically, Can improve the WLED light output cold heat ratio [6].
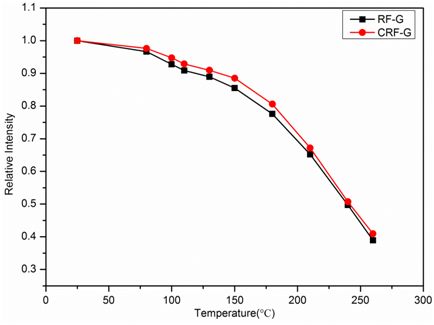
Figure 1.8 Thermal quenching performance of RF-G and CRF-G
Fig.1.8 The heat quenching properties of RF-G and CRF-G
This article uses the 2835 package, the target parameters for the Ra = 80-82, CCT = 3000K, using the same packaging solution to verify the compatibility of the powder and improve the consistency of the phosphor powder WLED output heat and cold The effect of the ratio is that the aforementioned two are represented as CRF-G and RF-G, respectively. Figure 1.8 shows the thermal quenching performance of RF-G and CRF-G. It can be seen that with the increase of temperature, the emission brightness of the phosphor shows a decreasing trend. The decreasing amplitude of CRF-G is smaller than that of RF-G. It shows that CRF-G has better thermal stability than RF-G in terms of phosphor itself.
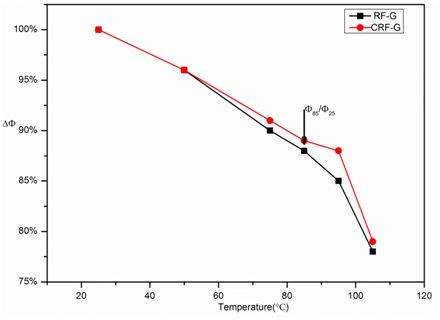
Figure 1.9 WLED light output heat-to-heat ratio relationship between RF-G and CRF-G
Fig.1.7 specific value of only the parameters of ordinary and high temperature of light output with WLED of RF-G and CRF-G
In this paper, the influence of the compatibility of powder adhesive on the cold-to-heat ratio of the WLED light output is adopted in the package form of 2835. The target parameters are Ra=80-82 and CCT=3000K. The same package solution is used to verify the improvement of the compatibility of the powder glue. The effect of powder on the cold-to-heat ratio of the WLED light output is shown in Fig. 1.9. The relationship between the CRF-G of the improved paste compatibility and the WLED light output heat-to-heat ratio of the unimproved powder-compatibility RF-G, as a function of temperature The WLED light output of the finished product's pearl light flux has a continuously lower heat-to-heat ratio. The attenuation amplitude of the CRF-G and RF-G in the finished product is the highest, and the CRF-G is the second, indicating the WLED light of the CRF-G. The output of hot and cold is better, and the W-LED output of RF-G is relatively poor in cold and heat output. Therefore, the compatibility of the adhesive has influence on the ratio of cold to heat output of the WLED. The phosphor that has improved the compatibility of the adhesive is not improved. The compatibility of the phosphor in the WLED light output heat-to-heat ratio is better.
3.4 Effect of Phosphor Morphology on the Thermal Output of WLED
The integrity and smoothness of the particle morphology of the phosphor have a certain influence on its stability. In the synthesis process of high-temperature solid-phase method, the solid-state powder undergoes phase transition under the environment of high-temperature and high-pressure gas protection, from solid phase to solid solution phase and thus solid phase reaction occurs, finally at the optimal synthesis temperature and the most Under the condition of good synthesis time, a new solid phase crystal body is formed. This phase needs to undergo a crushing process to form a phosphor powder with a certain particle size. The crushing process is generally carried out in a ball mill, prolongs the crushing time and increases the rotation speed of the ball, resulting in the smallest particles. The surface has broken marks, a certain amount of broken crumbs adhered to or the granules are directly smashed into flakes, so that the powder particles have a complete shape and smoothness. Through the abnormal ball mill crushing process, the particle shape of the phosphor is irregular or the surface of the particle is cracked. As shown in Figure 2.0, the left picture shows the shape of the phosphor particles broken by a strong ball mill, and the right picture shows the fluorescence of the normal crushing process. The powder particle morphology, through the foregoing analysis, can be inferred that the strong disruption is better than the normal broken particles.
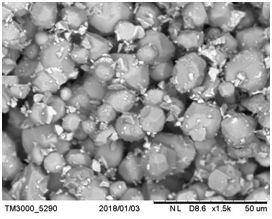
The left and right panels of Figure 2.0 are SEM images of GRF-N and GRF-V, respectively.
Fig.2.0 The SEM morphology of GRF-N (left) and GRF-V (right)
This article uses the 2835 package format, the target parameters for the Ra = 80-82, CCT = 3000K, using the same packaging program to verify the impact of intense crushing process and normal crushing phosphors on WLED light output heat and cold ratio, the aforementioned Both are represented as GRF-N and GRF-V, respectively. Figure 2.1 shows the thermal quenching performance of GRF-N and GRF-V. It can be seen that the emission brightness of the phosphors shows a decreasing trend with increasing temperature. The decreasing amplitude of GRF-V is smaller than that of GRF-N. It shows that GRF-V has better thermal stability than GRF-N in terms of phosphor itself.
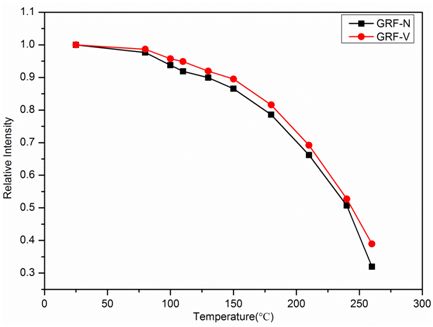
Figure 2.1 Thermal quenching performance of GRF-N and GRF-V
Fig.2.1 The heat quenching properties of GRF-N and CRF-V
In this paper, the influence of the strong crushing process and the normal crushing process on the cold-to-heat ratio of the WLED light output is 2835. The target parameters are Ra=80-82 and CCT=3000K. The same packaging scheme is used to verify the strong crushing process. The effect of process and normal crushing on the hot and cold state is shown in Figure 2.2. It shows the relationship between cold heat ratio and WLED light output of CRF-N and GRF-V in the post-treatment process. The ratio of cold to hot states of the pearl light flux of the finished product increases with temperature. In the continuous reduction, CRF-N and RF-V in the finished product attenuation amplitude GRF-N larger, followed by CRF-V, indicating that the GRF-V WLED light output heat better, GRF-N WLED light output The cold and heat are relatively poor, so the strong crushing process has an impact on the ratio of cold to heat of the WLED light output, and the phosphor after intense crushing process is inferior to the WLED light output of the phosphor of the normal crushing process.
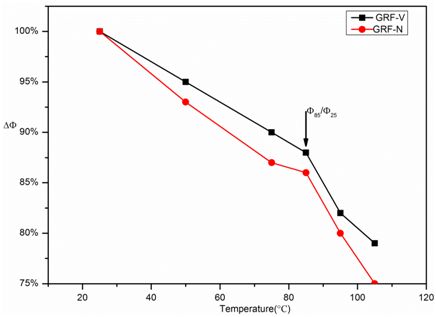
Figure 2.2 Relationship between WLED light output and heat-to-heat ratio of GRF-V and GRF-N
Fig.1.7 specific value of only the parameters of ordinary and high temperature of light output with WLED of GRF-V and GRF-N
4 Conclusion
This article uses SMD 2835 package form, using different materials of phosphor, different dispersion coefficient of phosphor, phosphor powder compatibility of different powder and different morphology of phosphor as yellow green powder packaging experiment, can be as follows Conclusion: The light output of the LED light source encapsulated with LUAG material, small dispersion coefficient, good powder compatibility and good particle morphology is better than the heat output.
Therefore, the physical properties of the phosphor have an effect on the cold-to-heat ratio of the WLED light output. The conclusion of this study serves as a basis for powder control and optimization of products. At the same time, it has theoretical guiding significance and practical reference value for WLED product design.
Reflecting Liquid Crystal Display

Reflecting Liquid Crystal Display,Electronic Instrument Displays,Electronic Watch Display,Clock Lcd Display
Dongguan Yijia Optoelectronics Co., Ltd. , https://www.everbestlcdlcm.com