
1
Foreword
Cadmium is a soft white metal with a silvery white or slightly blue luster at room temperature. It is commonly found in nature and has been widely used in industrial applications. However, its presence in the environment poses significant risks to both human health and ecosystems.
20
Since the beginning of the century, the production and use of cadmium have increased significantly, leading to higher levels of environmental release. Globally, approximately 10,000 tons of cadmium are released into the environment each year, with 82% to 94% entering the soil. This accumulation in soil directly affects agricultural products, particularly rice.
3
The ability of rice to absorb specific substances from the soil is influenced by its unique genetic makeup. Compared to crops like corn and soybeans, rice exhibits a stronger affinity for absorbing cadmium. This makes it especially vulnerable to contamination, which can lead to serious health consequences for those who consume contaminated rice.
In recent years, reports on heavy metal pollution, including cadmium, have become increasingly common in China. Studies conducted in the mid-1980s showed that cadmium contamination from irrigation water led to high levels of cadmium in rice, exceeding safety limits in over 71.69% of samples. While meat and poultry eggs generally remained within safe levels, the risk to rice consumption was alarming.
A survey between 2005 and 2009 in a southern province revealed that 64.4% of food samples tested positive for cadmium, with an over-standard rate of 7.3%. Contaminated foods included grains, fruits, edible fungi, aquatic products, and animal organs, indicating widespread exposure to cadmium pollution in certain regions. Excessive cadmium intake can cause severe damage to the kidneys and bones, leading to conditions such as "bone pain syndrome," kidney failure, and impaired absorption of essential nutrients like zinc.
2 Experimental Part
2.1 Reagents
(1) Hydrochloric acid: (extra pure grade, 36%, Ï=1.19g/ml).
(2) Nitric acid: (extra pure grade, 65%, Ï=1.42 g/ml).
(3) Perchloric acid: (extra pure grade, 72%, Ï=1.67 g/ml).
(4) 0.1% special reagent for cadmium analysis.
Accurately weigh 0.1g of the special reagent for cadmium analysis and dissolve it in 100ml of ultra-pure water. Stir until fully dissolved and set aside for use.
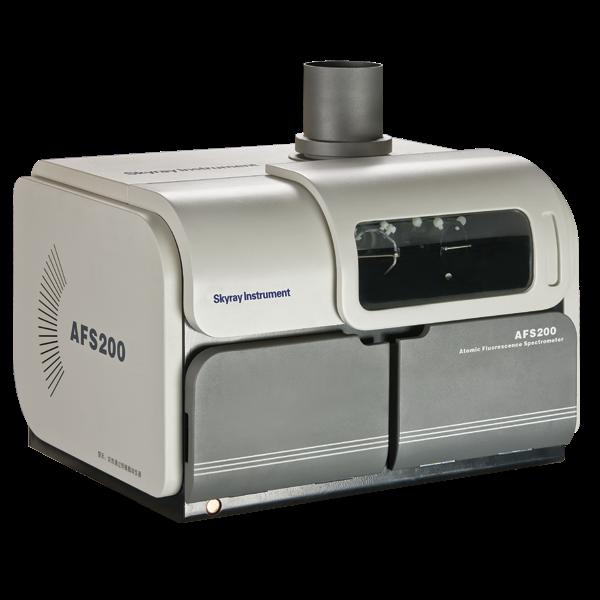
2.2 Instruments Used
(1) Two-channel atomic fluorescence spectrometer (AFS200T), cadmium hollow cathode lamp;
(2) Hot plate (SB-2.4);
(3) Laboratory-grade ultra-pure water purifier.
2.3 Instrument Working Conditions
Table 1: Instrument Parameter Settings
| Serial Number | Parameter | Parameter Value |
| 1 | Negative High Pressure (V) | 260 |
| 2 | Lamp Current (mA) | 35/35 |
| 3 | Argon Flow Rate (ml/min) | 300/800 |
| 4 | Filament Brightness | 3 |
| 5 | Reading Time (s) | 13 |
| 6 | Delay (s) | 3 |
| 7 | Blank Discriminant Value (s) | 5 |
2.4 Analysis Steps
2.4.1 Sample Digestion
Weigh 0.2g of rice sample and place it in a beaker. Add 8ml of nitric acid and 2ml of perchloric acid. Heat on a hot plate until the sample is completely digested and evaporated to dryness. Then add 2ml of HCl, transfer the solution to a 100ml volumetric flask, and dilute to volume with ultra-pure water. Add 5ml of 0.1% special reagent for cadmium analysis and mix thoroughly. Prepare a blank sample in the same way.
2.4.2 Sample Determination
Adjust the instrument according to the model's performance and working conditions. Allow the instrument to stabilize for 10–20 minutes before starting measurements. Inject standard blanks continuously until the readings stabilize. Then, prepare a standard curve using the standard series. Before measuring the sample, inject the blank value and take an average. Finally, measure the sample and print the results automatically.
3 Experimental Results
3.1 Preparation of Standard Curve and Correlation Coefficient
3.1.1 Preparation of Standard Solution
Use cadmium (Cd) standard solution (0.1ug/ml), extra pure hydrochloric acid (HCl), 0.1% cadmium analysis reagent, and ionized water (resistivity ≥ 10MΩ) to prepare the standard solutions.
Table 2: Preparation of Cadmium Standard Solution
| Serial Number | Concentrated Hydrochloric Acid Volume (ml) | 0.1% Cadmium Analysis Reagent Volume (ml) | Cadmium Standard Use Solution (0.1ug/ml) Volume (ml) | Constant Volume (ml) | Standard Solution Concentration (ng/ml) |
| 1 | 2 | 5 | 1 | 100 | 1 |
| 2 | 5 | 5 | 3 | 10 | 10 |
3.1.2 Standard Curve and Correlation Coefficient
Table 3: Cadmium Concentration and Fluorescence Intensity Values
| Cadmium Concentration (ng/ml) | 0 | 1 | 5 | 10 |
| Fluorescence Intensity Value | 0 | 496.152 | 1873.085 | 3602.660 |
3.2 Measurement of Cadmium Content in Rice Samples
Table 4: Sample Measurement Results
| Sample | Measurements (ng/ml) | Average Value (ng/ml) | |
| Rice | 88.92 | 85.95 | 82.98 |
3.3 Method Recovery
Table 5: Recovery Rate of Cadmium Measurement
| Sample | Theoretical Value | Actual Measured Value | Recovery Rate (%) |
| Rice | 87.00 | 88.92 | 102.21 |
| Rice | 82.98 | 95.38 |
4 Summary
The method demonstrated a high recovery rate of 95.38%. Additionally, it offers advantages such as high sensitivity, low detection limit, minimal matrix interference, and a simple and efficient procedure. These features make it a reliable choice for cadmium analysis in various samples.
Super Tweeter Bullet,Tweeter Driver,Speakers For Concert Speakers,Speakers For Performances
NINGBO RFUN AUDIO TECHNOLOGY CO.,LTD , https://www.mosensound.com