
Measuring the phase difference between two periodic signals typically requires the use of scientific techniques such as meteorology, computation, and communication. The oscilloscope provides a quick and easy way to perform this type of measurement. Unfortunately, the oscilloscope's noise, bandwidth, and time resolution limit the accuracy of its measurements.
The sampling rate of the oscilloscope determines the size of its time resolution. For example, for a 100 MHz signal, 1 degree in phase is equivalent to 27 ps in time. Obviously, for a 1 degree phase measurement accuracy, the oscilloscope's sampling time must be less than this value, so the sampling rate requirement is higher than 36 GHz, which is beyond the scope of most oscilloscopes. To demonstrate this measurement method, we chose Analog Arts' SA985 USB oscilloscope with a sampling rate of 100 GHz and a bandwidth of 1 GHz. You can do this with any oscilloscope that meets your application time requirements. With a suitable oscilloscope, you must also use specialized techniques to get accurate phase measurements.
The oscilloscope's timeline (Figure 1) provides the easiest way to measure the phase between two signals. The time difference between two corresponding points on the signal represents the phase in time. Multiplying this value by the signal period yields a phase result in degrees. The measurement accuracy of this method is highly dependent on the oscilloscope's noise and triggering uncertainty.
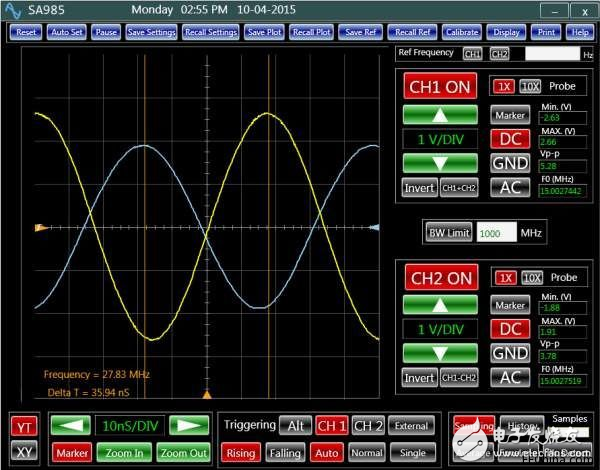
Figure 1: The timeline helps you measure the phase difference between the two signals.
People often use the Lissajous curve (Figure 2) to measure the phase between two sine waves. However, making accurate measurements based on the Lissajous curve is almost impossible. In addition, for non-sinusoidal signals, these curves are even more difficult to interpret.
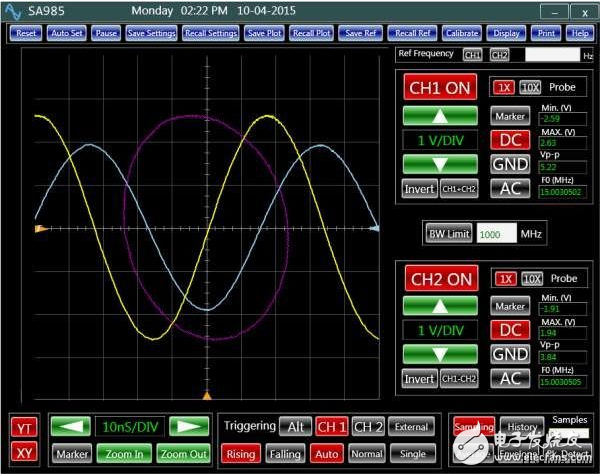
Figure 2: Basic Lissajous curve for measuring the phase difference between two sinusoidal signals.
Performing mathematical operations on the signal enhances phase measurement performance. The techniques described in references 1, 2 and 3 are some examples of such arithmetic operations. Although each method may be suitable for some applications, the measurement results are also affected by a variety of factors outside the scope of this article. In addition, most of these techniques are for sinusoidal signals. These techniques are significantly less accurate in applications such as measuring various clock phase performances generated by FPGA internal phase-locked loops (PLLs).
A simple and accurate method is to perform correlation operations on the signal. Correlation operations are a direct mathematical operation. There are many papers (Reference 4) that provide a thorough explanation of the relevant operations and their applications. A C# algorithm developed by Aanlog Arts is an implementation of this technology. Figure 3 shows the phase difference between two 200MHz sine waves obtained by this algorithm.
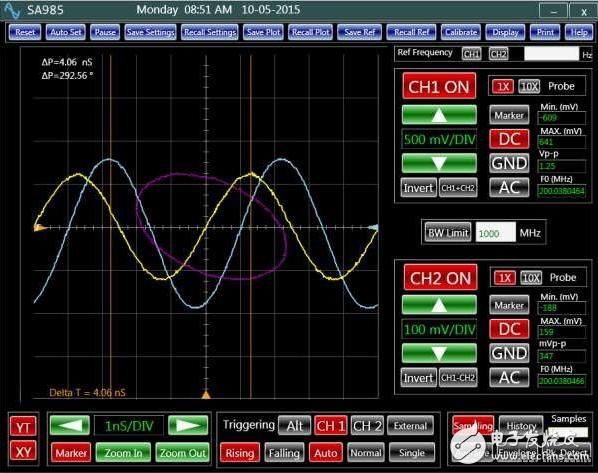
Figure 3: Correlation operations can help you calculate the phase difference between two signals.
A key advantage of correlation operations is the ability to find phase differences between most other types of signals. Figure 4 shows the phase difference between a sine wave and a square wave. Factors such as the DC component of the signal, noise, and triggering issues have no significant effect on the results. For applications where signal noise is the dominant factor, the averaging method can be used to reduce its effects.
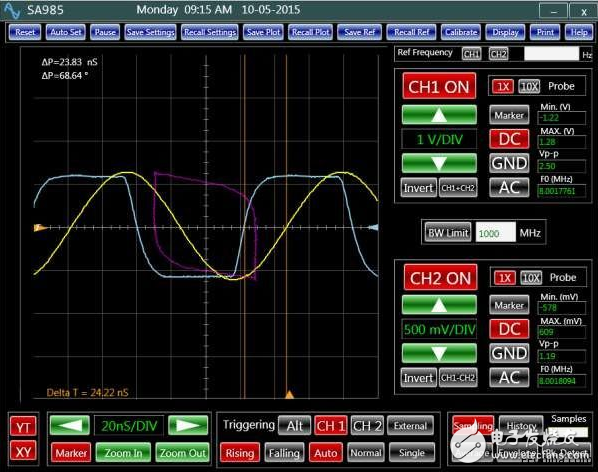
Figure 4: Using a correlation algorithm to get the phase difference between a sine wave and a square wave.
The accuracy that this technique can achieve is mainly limited by the relative accuracy of the signal period and the sampling rate of the oscilloscope. For signals with a sampling rate of 100 GHz and a relative frequency accuracy of 0.01 ppm, phase measurements better than 0.5 degrees are expected. The signal averaging method can further increase the measurement accuracy to 0.1 degrees.
Related operations have proven to be useful in practical applications where problems such as ringing, reflection, and rise time mismatch between signals can greatly limit the performance of other phase measurement techniques.
Anyang Kayo amorphous Technology Co.,
Ltd., founded in 2011 with a registered capital of RMB 5 million that is
a technology-based manufacture. We specialize in the production of
nano&amorphous iron core and amorphous&Nano Ribbon, CT, electric
component(including comon mode choke coil, Filter Inductance, high
frequency transformer,etc.).Our
main products are amorphous and nanocrystalline iron cores which are
widely used in communication, house appliances, electric power,
automobile, new energy and other fields.
Our DC immune single Cores have high permeability,low coercivity and loss,excellent performance on DC immue and temperature stability that can be widely used to the leakage protection switch.
Dc Immune Single Iron Core,Magnetic Core You Want,Excellent Magnetic Iron Core,Resisting Dc Iron Core
Anyang Kayo Amorphous Technology Co.,Ltd. , https://www.kayoamotech.com