
|

What is the effect of source impedance versus sound pressure when driving an audible PZT? This has a direct effect on the peak capacity of a power supply that is used for driving the PZT.
Is there any detectable sound pressure difference when driving an audible PZT single-ended versus bipolar, with the same peak to peak amplitude? This can impact drive circuit complexity.
What does the impedance of a PZT look like? This can affect peak power supply capacity as well as filtering requirements.
Three common PZTs manufactured by Mallory (North American Capacitor Company) were chosen for investigation of driving source impedance versus sound pressure, single and bipolar drive versus sound pressure, and PZT impedance characteristics.
Structure of PZTsFigure 1 illustrates a cut-away view of a typical audible PZT. A piezoceramic plate is plated with silver on both sides. One side is bonded to a thin brass plate around the piezoceramic plate's circumference using an adhesive. This side becomes one electrode connection. The other side of the piezoceramic plate becomes the second electrode contact. The brass plate is attached to a supporting ring, which is part of the molded plastic case, using a silicone adhesive.
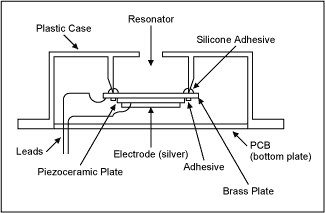
Figure 1. Cut-away view of audible PZT.
There are two possible ways to excite the audible PZT to produce sound; by driving it with a single-ended signal (ie, 0V to + 5V) or with a bipolar signal (ie, -2.5V to + 2.5V). Figure 2 illustrates the mechanical deflection about a midpoint of mechanical zero when an audible PZT is driven with a bipolar signal.
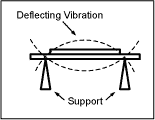
Figure 2. Bipolar deflection.
Figure 3 shows the mechanical deflection when a single-ended signal is used to drive the PZT. When a single-ended signal is applied, the PZT deflects one direction from the mechanical zero point. This unipolar deflection will be larger in amplitude from zero than when the bipolar signal was applied as in Figure 2. The resultant total deflection will be the same for a bipolar signal of -2.5V to + 2.5V as a single-ended signal of 0V to + 5V.
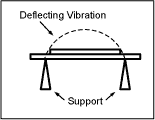
Figure 3. Single-ended deflection.
Equipment and Test Setup Equipment: Tektronix TDS3012 2-Channel Color Digital Phosphor Oscilloscope (100MHz, 1.25GS / s)
HP 33120 15MHz Function / Arbitrary Waveform Generator
Tektronix AM503 Current Probe Amplifier
Tektronix A6302 Current Probe
Radio Shack Analog-Display Sound-Level Meter, Cat. # 33-2050 (see Figure 4)
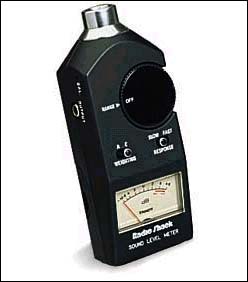
Figure 4. Radio Shack analog-display sound-level meter.
Test Setup: The test setup for testing sound pressure is shown in Figure 5. A box made of processed organic composite with sound-deadening qualities was lined with "dimpled" polyurethane foam to create a psuedo-anechoic chamber. The Radio Shack sound-level meter was placed outside of the chamber with the meter's microphone inserted into the chamber through a hole in the back of the chamber. An L-shaped cardboard stand was constructed, in which the PZT under test could be attached. This allowed for precise positioning of the PZT from the meter's microphone.
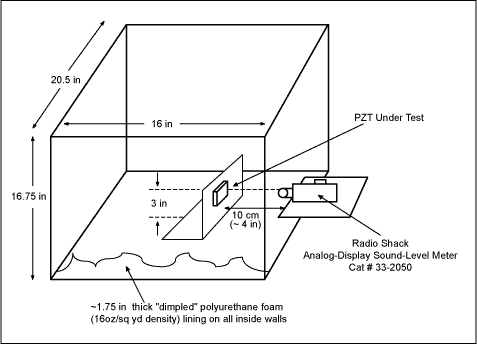
Figure 5. Sound pressure test setup.
Maxim Test Data Curves and Mallory PZT SpecificationsTable 1. Mallory PT-2745W Specifications
Model Number | PT-2745W | Unit |
| Resonant Frequency | 4.5 +/- 0.5 | kHz |
| Operating Voltage (Max) | 30 | Vpp |
| Sound Pressure Level (Min) | 90 at 4.5kHz at 10cm, 5V square wave | dB |
| Current Consumption (Max) | 1.5 | mA |
| Capacitance | 16,000 +/- 30% | pF |
| Operating Temperature | -20 to +60 | ° C |
| Storage Temperature | -30 to +70 | ° C |
NOTE: For PT-2745W frequency characteristics and package outline see Mallory data sheet at
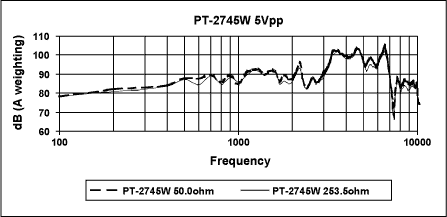
Figure 6. PT-2745W with 5Vpp excitation.
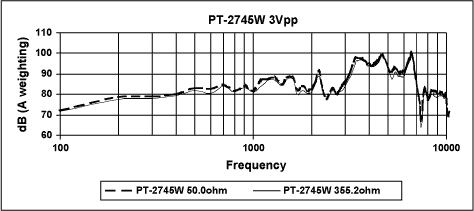
Figure 7. PT-2745W with 3Vpp excitation.
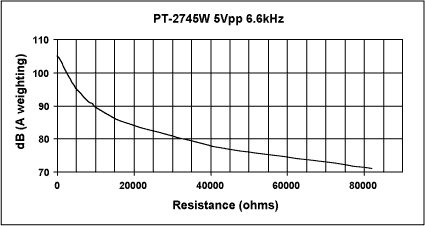
Figure 8. PT-2745W sound pressure vs. Rsource.
Table 2. Mallory PT-2060W Specifications
Model Number | PT-2060W | Unit |
| Resonant Frequency | 6.0 +/- 0.5 | kHz |
| Operating Voltage (Max) | 30 | Vpp |
| Sound Pressure Level (Min) | 90 at 6.0kHz at 10cm, 5V square wave | dB |
| Current Consumption (Max) | 1.0 | mA |
| Capacitance | 12,000 +/- 30% | pF |
| Operating Temperature | -20 to +60 | ° C |
| Storage Temperature | -30 to +70 | ° C |
NOTE: For PT-2060W frequency characteristics and package outline see Mallory data sheet at
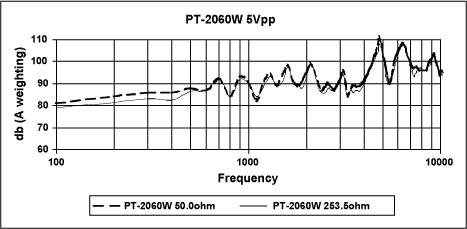
Figure 9. PT-2060W with 5Vpp excitation.
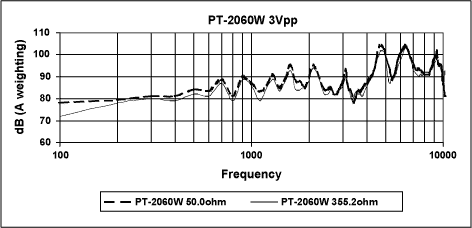
Figure 10. PT-2060W with 3Vpp excitation.
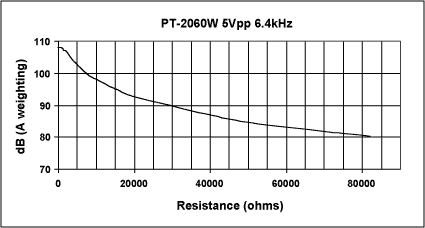
Figure 11. PT-2060W sound pressure vs. Rsource.
Table 3. Mallory PT-1240P Specifications
Model Number | PT-1240P | Unit |
| Resonant Frequency | 4.096 +/- 0.5 | kHz |
| Operating Voltage (Max) | 30 | Vpp |
| Sound Pressure Level (Min) | 80 at 4.0kHz at 10cm, 5V square wave | dB |
| Current Consumption (Max) | 2.0 | mA |
| Capacitance | 17,000 +/- 30% | pF |
| Operating Temperature | -20 to +60 | ° C |
| Storage Temperature | -30 to +70 | ° C |
NOTE: For PT-1240P frequency characteristics and package outline see Mallory data sheet at
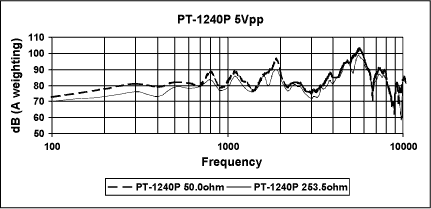
Figure 12. PT-1240P with 5Vpp excitation.
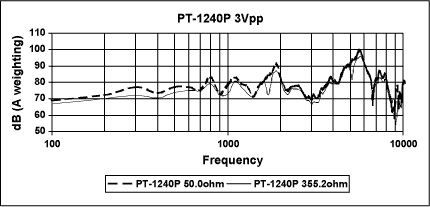
Figure 13. PT-1240P with 3Vpp excitation.
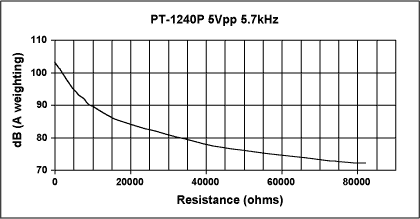
Figure 14. PT-1240P sound pressure vs. Rsource.
Evaluation of Data-PZT ImpedanceThe first fact that needed to be established is the impedance of the PZT. From the Mallory specifications it appears as if the PZT is entirely capacitive. A test was conducted on the PT-1240P to investigate how the PZT reacted to a square wave excitation with a known source impedance. Several tests were conducted with different source impedances. The one documented here is shown in Figure 15. The source impedance for this test was 253.5 Ω with a 0V to 5V square wave driving the PZT at its peak sound pressure output frequency of 5.6kHz. Both rising and falling edges were analyzed. Figure 15 shows an expanded view of the rising edge.
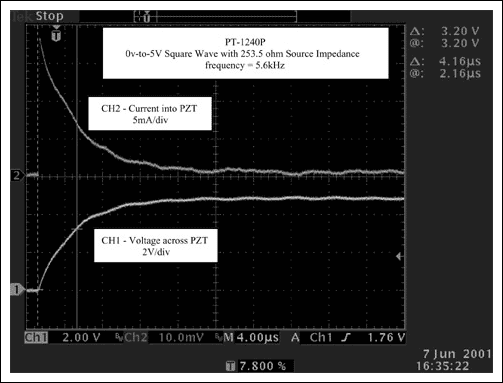
Figure 15. PT-1240P current and voltage waveform.
Since there is more resolution on the voltage waveform across the PZT, it was used to analyze the time constant formed by the source impedance and the suspected near-pure capacitance of the PZT. Remember the classical complete response formula for a source driving an RC circuit :
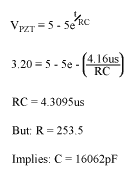
Specified capacitance for the PT-1240P is 17,000pF +/- 30%. Our measured capacitance was 16,062pF, which is about 5% under the nominal specified value of 17,000pF. This looks reasonable.
Expected peak current for this test should be 5V / 253.5 = 19.72mA. Measured current was 18.5mA which is believable since cable impedance and potential other error sources are not accounted for. From this test and similar test conducted on all PZTs studied, it appears for all practical purposes that the audible PZT impedance is purely capacitive and as such, current and voltage waveforms can be predicted by knowing the driving source voltage and source impedance.
Evaluation of Data-PZT Sound PressureDiscussions with Mallory confirmed that the Mallory specifications for sound pressure versus frequency were conducted using "A weighting" and by driving the PZT under test with a 50 Ω source impedance. To establish a baseline reference each PZT was tested in the Maxim sound pressure test setup (see Figure 5) by driving it with a 50 Ω source impedance. The resultant curves do not exactly match Mallory's curves (see respective data sheets on Mallory website at), which was expected based on the use of a psuedo-anechoic chamber and an average sound-level meter. However, the data curves were close enough to proceed forward with the intent of the experiment. Relative readings are sufficient since the main goal is to establish changes in performance of the PZT under test when conditions of source drive impedance and source drive type (bipolar or single-ended) are varied in the exact same test environment.
An empirical test was conducted to see at what dB (sound pressure) a degradation in loudness of the PZT could be detected. It was concluded that a decrease of any more than 10dB would be a noticeable change in loudness from the PZT. This seemed reasonable , as when referenced to Figure 16 it can be seen that the difference between an anechoic room and a quiet whisper is about 10dB. In integrated circuit design for a PZT driver, source impedance must be specified, since it is a major factor in the design of the output power stage for a PZT driver. The lower the source impedance required the larger the output power device and hence more die area and cost. One of the goals of this investigation was to determine what value of source impedance would be acceptable to drive a variety of PZTs at both 5Vpp and 3Vpp. One important criteria was to ensure that the sound pressure degradation was not more than 10dB.
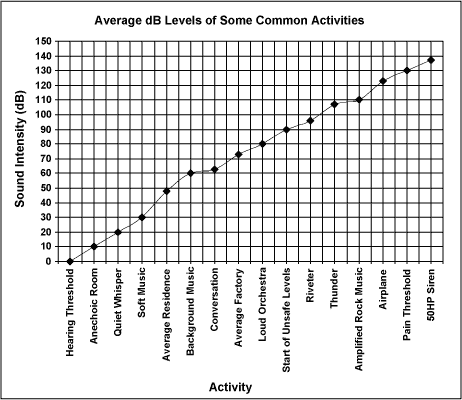
Figure 16. Average dB levels of some common activities.
Following the base-line test of a 50 Ω source impedance driving at 5Vpp and at 3Vpp to each Mallory PZT, separate tests were conducted at 5Vpp with a source impedance of 253.5 Ω, and at 3Vpp with a source impedance of 355.2 Ω. This variance in source impedance was chosen to yield less than a 10dB sound pressure difference over the entire frequency range from the 50 Ω source impedance tests. In addition, the difference in source impedances at 5V and 3V correlates to that expected in a semiconductor design output power device .
The results for each Mallory PZT can be reviewed in detail in Figures 6, 7, 9, 10, 12, and 13. In each case it can be clearly seen that for 5Vpp increasing the source impedance from 50 Ω (100mA peak current) to 253.5 Ω (19.7mA peak current) had far less than a 10dB degradation in sound pressure over the entire frequency range of the PZT. In addition for 3Vpp increasing the source impedance from 50 Ω (60mA peak current) to 355.2 Ω (8.45mA peak current) had far less than a 10dB degradation in sound pressure over the entire frequency range of the PZT.
Extensive tests were conducted with all three Mallory PZTs for a difference in sound pressure under bipolar drive conditions versus single-ended drive conditions for both 3Vpp and 5Vpp. There was no measurable difference for these PZTs, whether driven bipolar or single-ended.
An additional set of graphs are provided in Figures 8, 11, and 14 which show sound pressure versus source impedance for each Mallory PZT tested at the respective highest sound pressure producing frequency. It is apparent from these graphs that significantly higher source impedance can be used to drive audible PZTs and still achieve appreciable sound pressure amplitudes. ConclusionThree common PZTs manufactured by Mallory (North American Capacitor Company) were chosen for investigation of driving source impedance versus sound pressure, single and bipolar drive versus sound pressure, and PZT impedance characteristics. The Mallory PT-2745W, PT-2060W, and PT-1240P were chosen for their different peak sound pressure frequencies as well as capability to operate at 3Vpp and 5Vpp.
What is the effect of source impedance versus sound pressure when driving an audible PZT? In all three devices tested source impedance could be increased from 50 Ω to 253.5 Ω at 5Vpp excitation and from 50 Ω to 355.2 Ω at 3Vpp excitation with much less than a 10dB reduction in sound pressure amplitude over the entire frequency operating range of the PZT. Curves of source impedance versus sound pressure amplitude at peak sound pressure producing frequency were developed for all three PZTs tested as a guide to designing higher source impedance drivers to minimize peak power supply and driver currents and yet maintain an acceptable reduction in sound pressure amplitude.
Is there any detectable sound pressure difference when driving an audible PZT single-ended versus bipolar, with the same peak to peak amplitude? Extensive testing on all three Mallory devices emphatically concluded that there is no measurable difference between driving these devices either with a bipolar or single-ended excitation from 3Vpp to 5Vpp. If other devices are to be considered it should be certain that their rating for Vpp drive is above 10Vpp if they are to be used at 5V single-ended drive in order to prevent mechanical damage to the device due to over-extension of the piezoceramic element.
What does the impedance of a PZT look like? For practical design considerations the predominant characteristic of the PZTs is pure capacitance. Current and voltage waveforms across the PZT can be accurately predicted by using the impedance of the driving source and the capacitance of the PZT.
AcknowledgmentsA special note of thanks to David Kuo, Engineering Intern at Maxim Integrated Products, Tucson Design Center, for his dedication and diligence in helping construct and conduct the experiments required to analyze the PZTs used in this application note.
References Radio Shack Operating Manual for Analog-Display Sound-Level Meter, Catalog # 33-2050 ()
Mallory Sonalert Products, Inc. ()
Dae Young Electronics Co., Ltd. ()
Introduction
SCOTECH manufactures a full range of pad mounted distribution transformers, it consists of HV compartment, LV compartment and Transformer compartment, they are compact power system for utility, commercial and industrial applications. the Pad Mounted Transformer can be installed indoor or outdoor and designed to withstand most of the environments. it can also be designed specifically for the solar photovoltaic generator applications.
Scope of supply
Primary voltage up to 35KV
Rated power: up to 5MVA
Standards
SCOTECH`s pad mounted distribution transformers are designed and manufactured in accordance with all major international standards (IEC, ANSI, UL, etc.)
Why SCOTECH
Long history- Focus on transformer manufacturing since 1934.
Technical support – 134 engineers stand by for you 24/7.
Manufacturing-advanced production and testing equipment, strict QA system.
Perfect service-The complete customer service package (from quotation to energization).
Pad Mounted Transformer
Pad Transformer,Pad Mounted Transformer,3 Phase Pad Mounted Transformer,Pad Mounted Distribution Transformer
Jiangshan Scotech Electrical Co.,Ltd , https://www.scotech.com